


Melies AI iconMelies AI
Seedance AI video generator in the browser: text, image and reference to video with native synced audio, multi-shot scenes, clips up to 30 seconds and 1080p, no watermark.
Sellerview.ai icon

Sellerview.ai

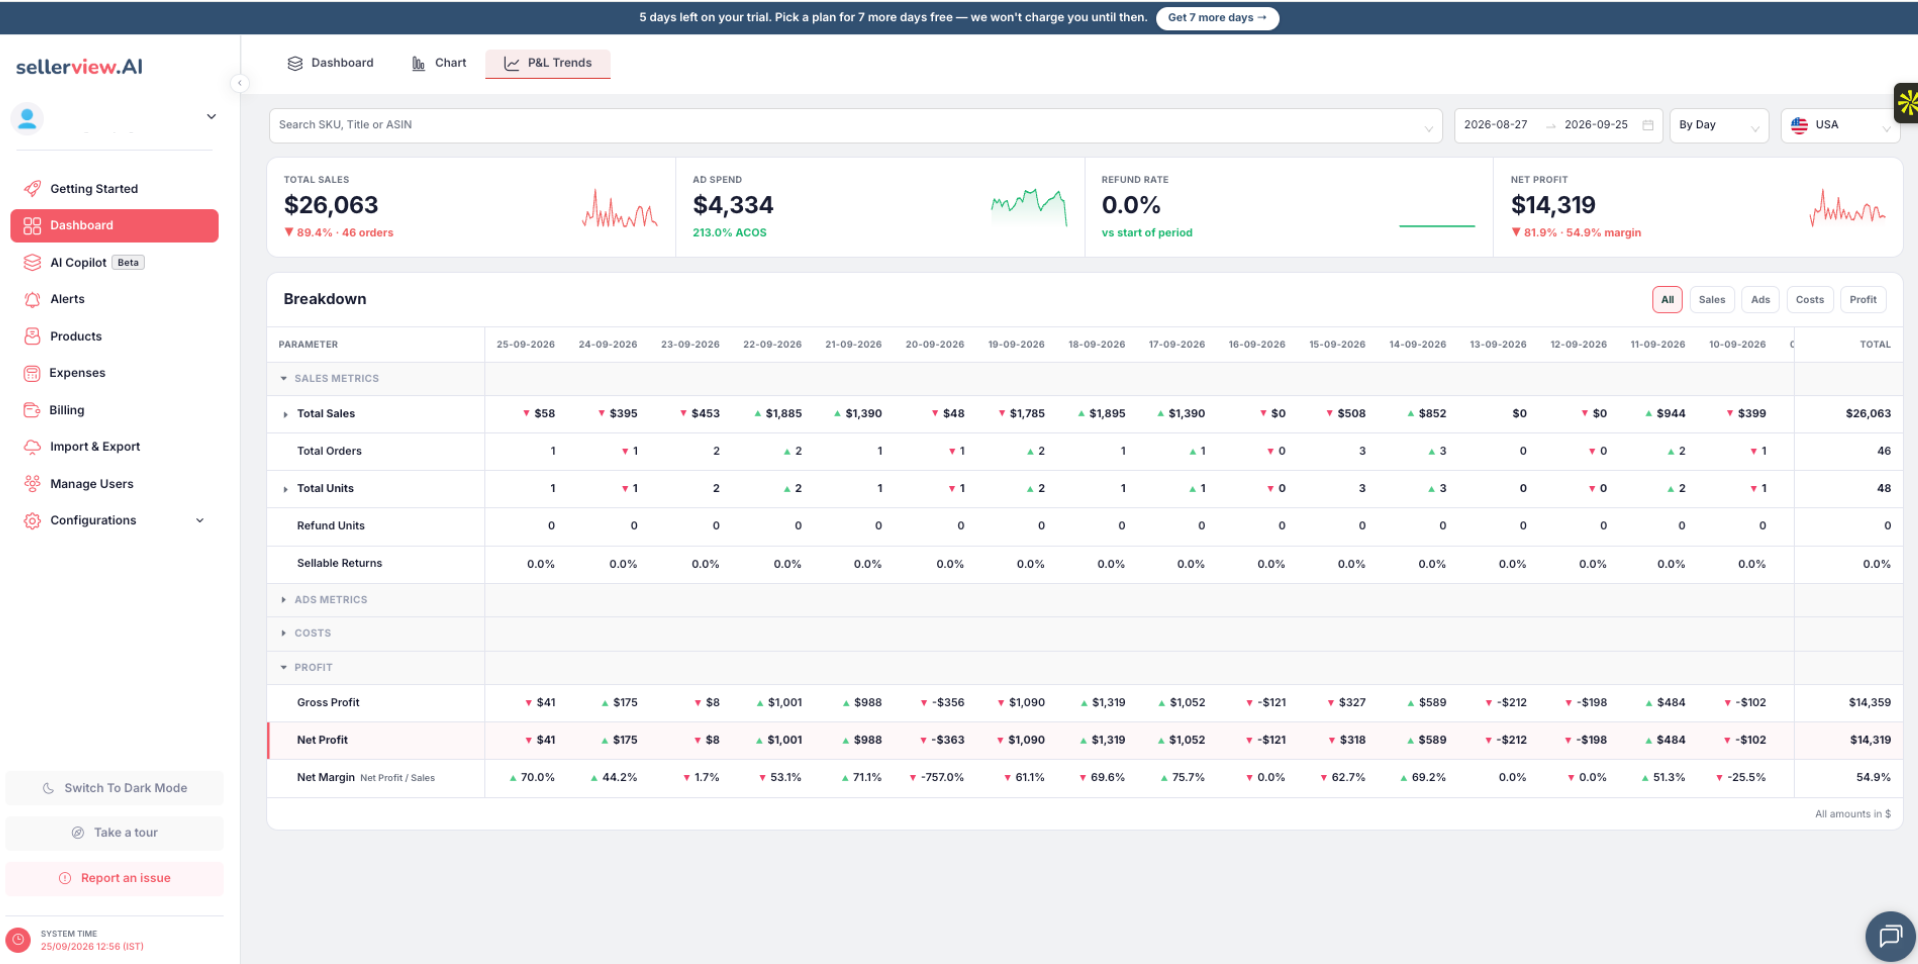
SKU-level profit analytics for Amazon FBA/FBM sellers. Track true TACoS/ACoS, fees, refunds, and COGS to see real net profit per SKU, not just revenue.

Sellerview.ai screenshot
analytics chrome extension amazon fba ecommerce
By Himanshu From Sellerview

Most Amazon sellers track revenue, not profit. Fees, FBA costs, storage, refunds, ad spend, and COGS all live in different reports, so real per-SKU profitability stays hidden until month-end, if it shows up at all.

Sellerview.ai reconciles all of it at the SKU level, automatically. It was built by a team that runs Amazon for 300+ brands, as the tool they needed themselves.

Key Features

  • Profit per product — What every SKU really made after fees, ads, returns, and COGS.
  • True TACoS and ACoS — Per SKU, with break-even ACoS, not account-wide averages.
  • COGS and expense tracking — Set cost rules per SKU or variant and add overheads like salaries, rent, and tools.
  • Same-day alerts — Know when fees, prices, the Buy Box, listings, or ratings change, for your listings and competitors’. Alerts can go to email or WhatsApp.
  • Ask Co-pilot — Ask questions about your own account in plain English and get answers that cite your SKUs, fees, and ad spend.
  • Multi-marketplace — 20+ Amazon marketplaces in one dashboard, with currencies converted automatically.
  • Mobile apps and Chrome extension — The same numbers on iOS, Android, and in the browser.

Who It’s For

  • Individual Amazon FBA/FBM sellers who want a trustworthy net profit number
  • Brands scaling ad spend that need to know which products lose money on PPC
  • Agencies protecting margin across multiple client accounts

Pricing

  • Basic: $15/month billed annually. Real profit per SKU, cost tracking, up to 3,000 orders a month, 60 days of history, and email alerts.
  • Complete: $79/month billed annually ($99 month-to-month). Unlimited orders, full history, leak alerts, 500 Co-pilot questions and 1,000 WhatsApp alerts a month, and up to 5 team members.

Both plans include a 3-day free trial with no card required. Free Amazon profit calculator and listing checker tools are available without an account.

Frequently asked questions

How is Sellerview different from Amazon Seller Central?

Seller Central shows revenue and basic fees but never calculates true profit per SKU. Sellerview combines fees, ad costs, returns, and your COGS into one P&L per product.

Is my Amazon data safe?

Sellerview connects through Amazon's official SP-API using OAuth, so you never share your password, and you can revoke access from Seller Central at any time.

Does it support multiple marketplaces?

Yes. It covers 20+ Amazon marketplaces across North America, Europe, and the Far East, converts currencies automatically, and shows profit per marketplace.

How much does it cost?

Basic is $15/month billed annually (up to 3,000 orders a month). Complete is $79/month billed annually or $99 month-to-month, with unlimited orders. Both start with a 3-day free trial, no card needed.

Traffic & authority

Updated

Monthly visits
7.6K
+1% vs prior month
Domain Rating
46
Checked Nov 10, 2026
Global rank
#2,406,504
Rank in United States
#1,456,027
Bounce rate
34%
Oct 2026
Pages per visit
2.04
Oct 2026
Time on site
1m 5s
Oct 2026
Site title
Amazon India GST: How It Changes Your Real Margin (2026)
Domain registered
Jun 13, 2024
Domain expires
Jun 13, 2028

Site description: “Most Amazon India sellers miscalculate profit by 8–15%. GST on FBA fees and input tax credit are the hidden margin killers. Fix your calculation today.”

Monthly visits · updated Nov 10, 2026

Aug: 7.7K 7.7K Aug Sep: 7.5K 7.5K Sep Oct: 7.6K 7.6K Oct

Domain Rating changes · by check date

Oct 11: 38 38 Oct 11 Nov 10: 46 46 Nov 10

Traffic sources · Oct 2026

  • Direct 40.1%
  • Search 32.9%
  • Referrals 10.2%
  • Social 5.4%
  • Email 3.1%
  • Display ads 2.8%
  • Affiliate 2.1%
  • AI assistants 1.4%
  • Paid search 1.4%
  • Paid social 0.7%

Source mix by month

Jul · Direct: 0% Jul · Search: 0% Jul · Social: 0% Jul · Referrals: 0% Jul · Paid: 0% Jul · Email: 0% Jul · Other: 0% Aug · Direct: 32% Aug · Search: 31% Aug · Social: 7% Aug · Referrals: 12% Aug · Paid: 7% Aug · Email: 5% Aug · Other: 6% Sep · Direct: 39% Sep · Search: 34% Sep · Social: 6% Sep · Referrals: 10% Sep · Paid: 3% Sep · Email: 3% Sep · Other: 4% Jul Aug Sep
Direct 39% Search 34% Social 6% Referrals 10% Paid 3% Email 3% Other 4%

Top countries

  • United States 44.2%
  • India 31.6%
  • United Kingdom 11.1%
  • Pakistan 7.8%
  • Singapore 5.3%

Top search keywords

Keyword Searches/mo CPC Est. value
amazon seller central 517,330 $1.09 $460
amazon product analytics 80 — $140
> sellerview.ai 50 — $140
halloween item: a damage fee will apply if returned used or altered. 2,320 — $110
tools on amazon us retail arbitrage 100 — $100